 |
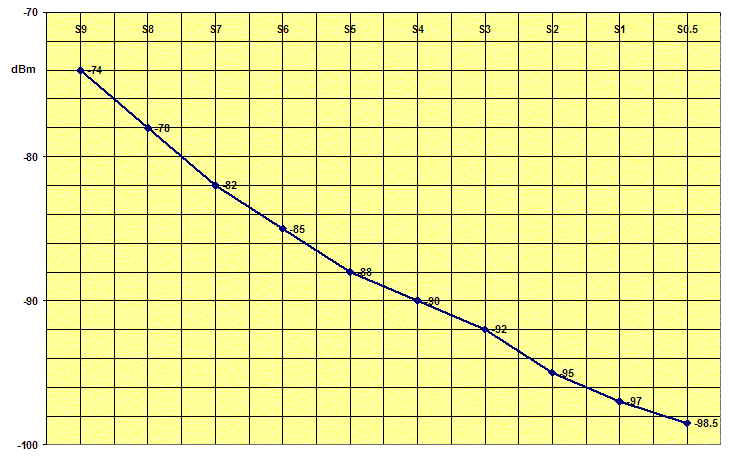
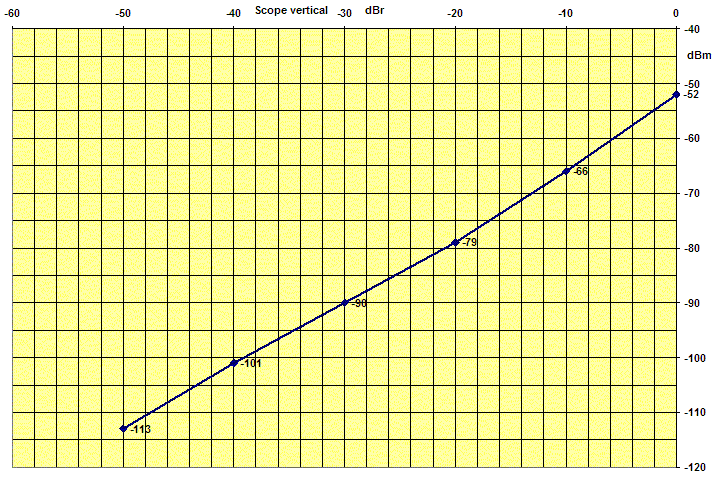
Figure 1 is a curve showing S-meter reading vs. input signal power in dBm. Figure 2 is a curve showing the relationship between the Spectrum Scope vertical amplitude in dBr (0 dBr = top of scale) and input signal power in dBm. Table 1 gives RF ATT setting vs. actual attenuation.
IC-756Pro II S/N 26XX. Freq.: 14500.000 kHz CW. BW = 500Hz (BPF lit), Preamp off, ATT off, NR off, NB off, AGC FAST, Twin PBT neutral (SFT = 0), RF Gain at 100%. HP8640B signal generator (checked against R&S URV4 RF millivoltmeter), set to CW, 14500.000 kHz, LOCK on, and connected to ANT 2. ANT 1 terminated in 50Ω. Note: -73 dBm = 50 µV in 50Ω.
 |
 |
| ATT setting dB | Atten. dB |
|---|---|
| 0 | 0 |
| 6 | 7 |
| 12 | 13 |
| 18 | 19.5 |
Copyright © 2005 A. Farson VA7OJ/AB4OJ (including images & data). All rights reserved.
Last updated: 09/25/2019