| |
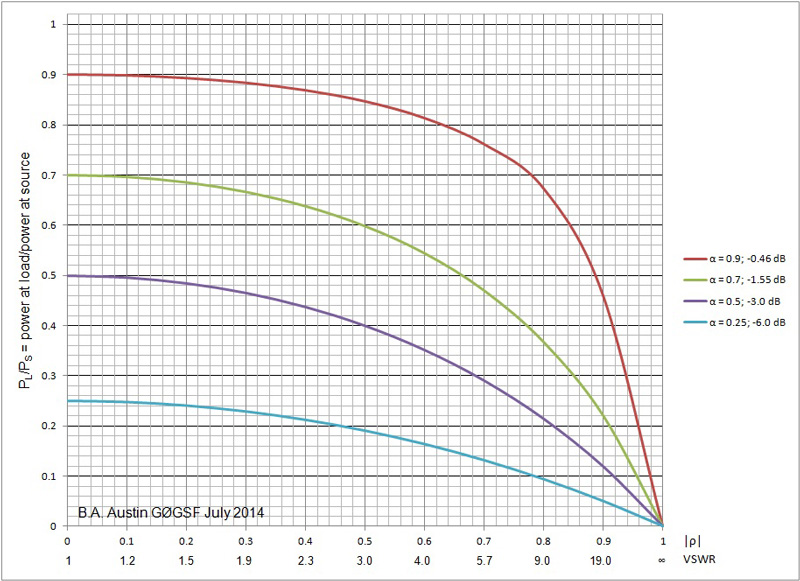
The family of curves in Figure 1 is derived from a mathematical expression (Equation 1, below) relating the ratio of output to input power in a lossy, mismatched transmission line. The effect of both the total mismatch loss (intrinsic line loss α + augmented loss due to standing waves on the line) and the reflection coefficient (|ρ|) is clearly visible.
The curves illustrate clearly how these various parameters interact, with PL (the power delivered to the load) decreasing dramatically with severely mismatched loads even when the intrinsic line loss is minimal (other than when PL = 0, when the degree of mismatch makes no difference at all, of course).
![]() It should be noted that that ρ (rho) represents |ρ|, the magnitude of reflection coefficient in all expressions and resulting calculations, and on the X-axis of Figure 1.
It should be noted that that ρ (rho) represents |ρ|, the magnitude of reflection coefficient in all expressions and resulting calculations, and on the X-axis of Figure 1.
Intrinsic line loss α is expressed as a numerical value 0 < α < 1, where α = 1 for a lossless line. Curves for the range 0.25 ≤α ≤ 0.9 are shown here.
Attenuation A is specific to each type of transmission line. A in dB = attenuation in dB/unit length X length = 10 log α.
The ratio of power at load PL to power at source PS is given by Equation 1.
| | Equation 1 |
where α = intrinsic line loss and ρ = reflection coefficient.
Also,
| | Equation 2 |
For convenience, a VSWR scale is shown below the |ρ| scale of Figure 1.
Copyright © 2014 B.A. Austin GØGSF and A. Farson VA7OJ/AB4OJ. Last updated: 09/25/2019
![]()